
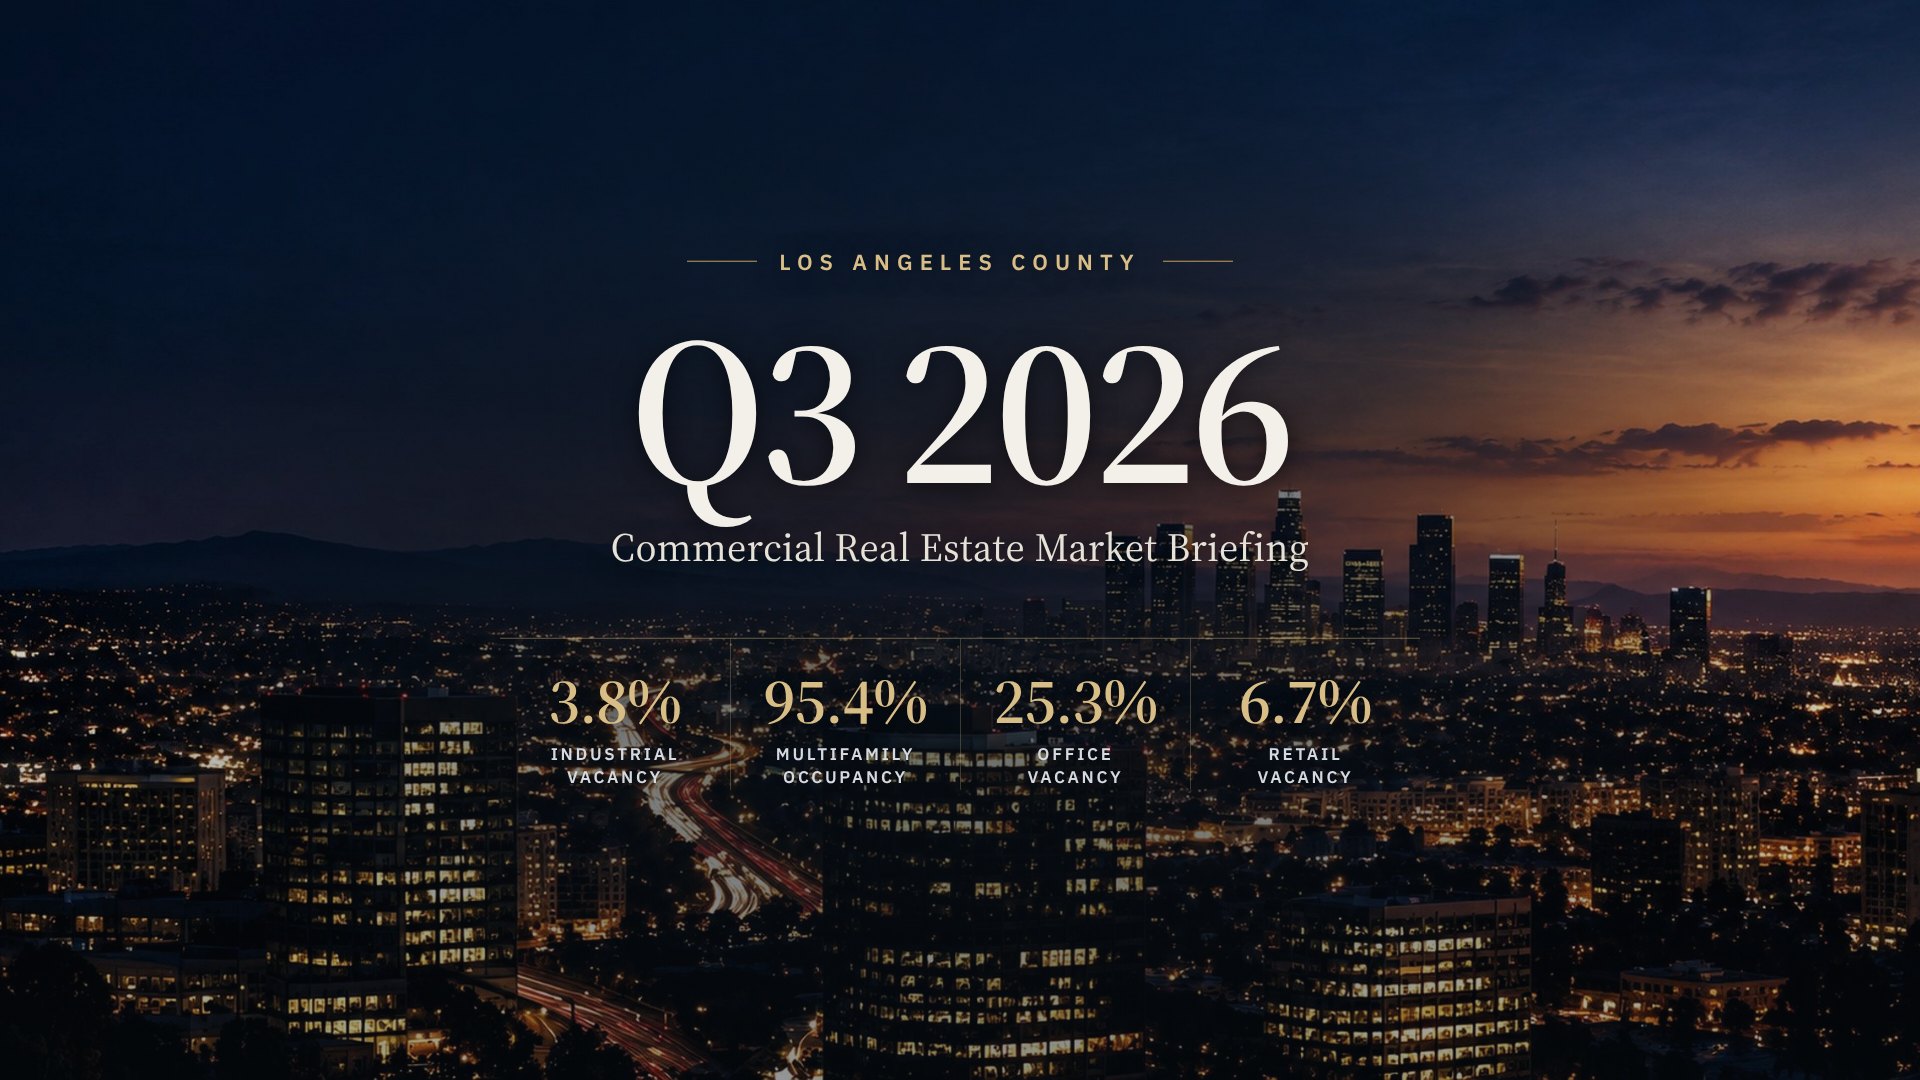
As of Q3 2026, Los Angeles County is a split market. Infill industrial is in a real recovery, and multifamily is attracting most of the investment capital. Office is stabilizing slowly, led by quality assets, while retail fundamentals stay soft despite active buying.
Financing is easing at the margin. New origination rates for all four property types are 6.22–6.23%, about 55 bps below Q3 2025.
| Sector | Vacancy / Occupancy | Latest Absorption | Crexi Market Cap Rate | Crexi Closed $/SF | Read |
|---|---|---|---|---|---|
| Office | 25.3% vacancy (CBRE Q3) | -432,758 SF (C&W Q3) | 5.80% | $407.38 | Quality-led stabilization; Downtown distressed |
| Industrial | 3.8% vacancy (Colliers Q2, LA County) | +1.91M SF (CBRE Q3) | 4.80% | $316.71 | Recovery underway; rents still correcting |
| Multifamily | 95.4% occupancy (CBRE Q2) | n/a | 5.00% | $407.20 | Capital magnet; rents flat |
| Retail | 6.7% vacancy (Colliers Q1) | -448,311 SF (Colliers Q1) | 5.26% | $438.88 | Soft fundamentals, active buyers |
Market Scan: Q3 2026
- Office vacancy (CBRE Q3): 25.3%. Dipped QoQ; leasing +11.6% YoY.
- Industrial vacancy (LA County): 3.8%. Down 50 bps QoQ (Colliers Q2).
- Q3 industrial net absorption: 1.91M SF. The fourth straight positive quarter.
- Multifamily occupancy: 95.4%. Up 0.1 pt vs. Q1 (CBRE Q2).
- Retail vacancy (LA County): 6.7%. Up from 6.6% (Colliers Q1).
- New origination rate (office / multifamily / retail): 6.22%, vs. 6.77% in Q3 2025.
Office: Quality Holds, Downtown Remains Distressed
Office fundamentals are stabilizing, but only at the top of the market. Signals are mixed across brokers.
- Colliers (Q2): vacancy of 25.6%. Absorption improved to -84,933 SF from -274,060 SF in Q1, and sublease availability fell for an eighth straight quarter to 3.2%.
- Cushman & Wakefield (Q3): -432,758 SF of absorption and 2.2M SF of leasing, down 14.9% QoQ. Asking rents still rose 2.8% YoY to $3.70/SF/mo FSG.
- CBRE (Q3): vacancy dipped to 25.3%, with leasing up 11.6% YoY. Only 33K SF delivered, and the pipeline is about 1.65M SF.
| Submarket | Vacancy | Asking Rent ($/SF/mo FSG) | Note |
|---|---|---|---|
| Century City | 14.7% | $7.76 | Tightest in county; Century City Center (730K SF) 95%+ preleased |
| Beverly Hills | 15.8% | $6.36 | Positive absorption |
| SFV & Ventura | 19.5% | $2.71 | Tightest larger submarket; +170,182 SF YTD |
| West Los Angeles | 24.6% | $5.25 | Half of top 20 Q2 leases |
| Hollywood/Mid-Wilshire | 29.0% | $3.24 | +94,194 SF Q2 absorption |
| Culver City | 32.9% | n/a | Habitat (253K SF) under construction |
| Downtown | 34.5% | $3.94 | Brookfield towers traded at $107–$151/SF |
Century City, Beverly Hills, and Culver City vacancy is from Colliers Q1 2026. All other figures are Q2 2026.
Capital markets confirm the reset:
- Downtown’s Bank of America Plaza traded to Capital Group for $210M ($150.89/SF). Wells Fargo Center North sold for $150M ($107.09/SF).
- Countywide office pricing fell 23.5% YoY to about $250/SF in July.
- On Crexi, closed pricing held flat at $407.38/SF, while the market cap rate rose 3.8% QoQ to 5.80%.
- Crexi sale days on market stretched to 279 (+8.8% QoQ), and signed lease rates held near $30.00/SF/yr.
Industrial: Infill Recovery Gaining Traction
LA County posted 4.18M SF of Q2 net absorption, its strongest quarter since Q4 2022. Vacancy reached 3.8%, compared with 5.5% for Greater LA and 7.8% for the Inland Empire.
CBRE added 1.91M SF in Q3 for 5.09M SF YTD, with leasing of 13.67M SF (+6.5% YoY). That was the first YoY vacancy decline in at least two years. Advanced manufacturing and aerospace are key drivers: Valar Atomics took 512K SF and Hadrian preleased 260K SF in Torrance.
| Submarket (Colliers Q2) | Vacancy | Q2 Net Absorption | Asking Rent ($/SF NNN) |
|---|---|---|---|
| Central LA | 3.2% | 1,129,480 SF | $1.24 |
| South Bay | 4.5% | 1,296,930 SF | $1.48 |
| San Gabriel Valley | 3.1% | 780,104 SF | $1.32 |
| San Fernando Valley | 3.8% | 159,330 SF | $1.45 |
| Mid-Counties | 5.3% | 811,794 SF | $1.30 |
| LA County Total | 3.8% | 4,177,638 SF | $1.39 |
Rents are still correcting but may be near a floor:
- Savills recorded a 13th consecutive quarterly decline, to $1.23/SF NNN.
- South Bay rents held flat at $1.48, ending 11 quarters of decline.
- Port of Long Beach TEUs rose 31.7% YoY and Port of LA rose 17.0% YoY in May.
- On Crexi, the market cap rate compressed to 4.80% (-9.9% QoQ) against a 5.46% asking cap rate, and closed pricing fell 2.6% QoQ to $316.71/SF.
- Crexi active LTVs tightened to 70% from 79% in Q2.
Big-box pricing has reset sharply. The median sale price for 75K+ SF buildings fell 19% YoY, from $276/SF to $224/SF. About 28.6M SF is proposed or under construction (roughly 39% of the market), concentrated in North County.
Multifamily: Capital Magnet With Flat Rents
Multifamily accounted for $1.22B (58%) of July’s roughly $2.1B in county investment sales. Volume rose 55% and pricing rose 28.7% YoY.
- Occupancy: 95.4% per CBRE.
- Vacancy and rent: NAI Capital pegged Q1 vacancy near 5.5%, average asking rent at $2,278/unit, and the cap rate at 5.7%.
- Tone: Lee & Associates describes the market as “stable but cooling.”
| Metric (Crexi) | Q3 25 | Q4 25 | Q1 26 | Q2 26 | Q3 26 |
|---|---|---|---|---|---|
| Signed Rent ($/unit/mo) | 2,274 | 2,317 | 2,397 | 2,400 | 2,398 |
| Sales Listings | 2,137 | 2,453 | 3,654 | 4,448 | 4,562 |
| Sale Days on Market | 132 | 137 | 163 | 131 | 115 |
| Market Cap Rate | 5.21% | 5.25% | 5.17% | 4.99% | 5.00% |
Crexi Q3 detail:
- Closed pricing was $360,000/unit (+1.9% QoQ). Asking was $382,500/unit, with a 5.27% asking cap rate.
- 1BR asking rent was $1,995 and 2BR was $2,640.
- NOI rose 0.7% QoQ, and DSCR is a healthy 2.03.
- Listing supply has more than doubled YoY, which is worth watching against the strong deal flow.
Retail: Weak Fundamentals, Active Buyers
LA County retail returned 448K SF in Q1, after its first positive quarter in nearly three years (+494K SF in Q4 2025). Leasing fell 24% QoQ to 1.2M SF. IRR places the market in Recession Stage 2 and forecasts a 2.0%–2.9% value decline over 12 months. Even so, Q2 transaction volume reached $4.9B (+40% YoY).
| Property Type (Colliers Q1) | Vacancy | Net Absorption | Asking Rent ($/SF/mo NNN) |
|---|---|---|---|
| Regional Malls | 9.9% | 87,369 SF | $1.84 |
| Lifestyle Centers | 7.7% | -53,405 SF | $3.27 |
| Community/Neighborhood | 7.3% | -396,234 SF | $2.46 |
| Single Tenant | 5.7% | 40,976 SF | $2.90 |
| Strip Centers | 5.6% | 38,784 SF | $2.72 |
| Power Centers | 5.4% | -165,801 SF | $2.67 |
| LA County Total | 6.7% | -448,311 SF | $2.60 |
Crexi Q3 detail:
- The retail market cap rate rose to 5.26%, with a 5.39% asking cap rate.
- Closed pricing slipped 1.2% to $438.88/SF.
- NOI fell 8.6% QoQ.
- Signed lease rates slipped 1.1% QoQ to $33.00/SF/yr.
- Lenders are extending leverage, with active LTV at 84%.
IPA forecasts year-end vacancy near 6.9% and rent near $32.66/SF, with strong demand for net-leased QSR assets.
Financing Conditions by Sector
| Sector | Active Mortgage Rate | Active LTV | New Origination Rate (Q3 26) | New Origination Rate (Q3 25) |
|---|---|---|---|---|
| Office | 6.35% | 80% | 6.22% | 6.77% |
| Industrial | 6.33% | 70% | 6.23% | 6.78% |
| Multifamily | 6.26% | 75% | 6.22% | 6.77% |
| Retail | 6.32% | 84% | 6.22% | 6.77% |
New debt is pricing about 55 bps cheaper than a year ago in every sector. Industrial carries the tightest leverage and retail the loosest.
Forward Signals
Office: Inventory has shrunk from 221.4M SF to 208.0M SF YoY through owner-user buys and conversions. Together with falling sublease availability, that is mechanically supporting vacancy. Century City Center’s preleased delivery should reinforce the flight to quality.
Industrial: YTD deliveries are down to 1.0M SF from 2.3M SF, and AB 98 now restricts large infill warehouse development. Both favor existing infill owners. The risk sits in big-box product and North County supply.
Multifamily and retail: Strong capital flows will be tested by more than double the multifamily listing supply. Retail recovery is likely to stay selective, favoring single-tenant, strip, grocery-anchored, coastal, and transit-oriented formats.
The Bottom Line
Los Angeles County heads into Q4 2026 with infill industrial and multifamily as the clearest conviction plays. Office upside is limited to Westside trophy nodes and well-capitalized Downtown recapitalizations. Retail remains a stock-picker’s market. Easing origination rates are a tailwind across all four sectors.
A Few Cautions on Reading These Numbers
- Brokerage vacancy figures use different methodologies and geographies. Industrial vacancy, for example, ranges from 3.8% to 6.8% depending on the source.
- Current-quarter third-party statistics were not available, so several fundamentals reflect Q2 or Q1 2026.
- Crexi metrics cover the full Los Angeles-Long Beach-Anaheim CBSA.
- Q3 closed-sale counts appear to reflect partial-quarter reporting, so treat the volume drop with care.
Thinking about buying, selling, or refinancing in Los Angeles County?
Every submarket and asset type is moving differently. Understand where your property stands today before you make your next move.
Request a confidential property valuation from One West Group.
One West Group | eXp Commercial
Investment Advisory | Capital | Brokerage
Sources: CBRE, Colliers, Cushman & Wakefield, Savills, NAI Capital, Lee & Associates, IRR, IPA, and Crexi market data, as cited. Market commentary dated October 18, 2026. This briefing is provided for general information and does not constitute investment, lending, legal, or tax advice.