
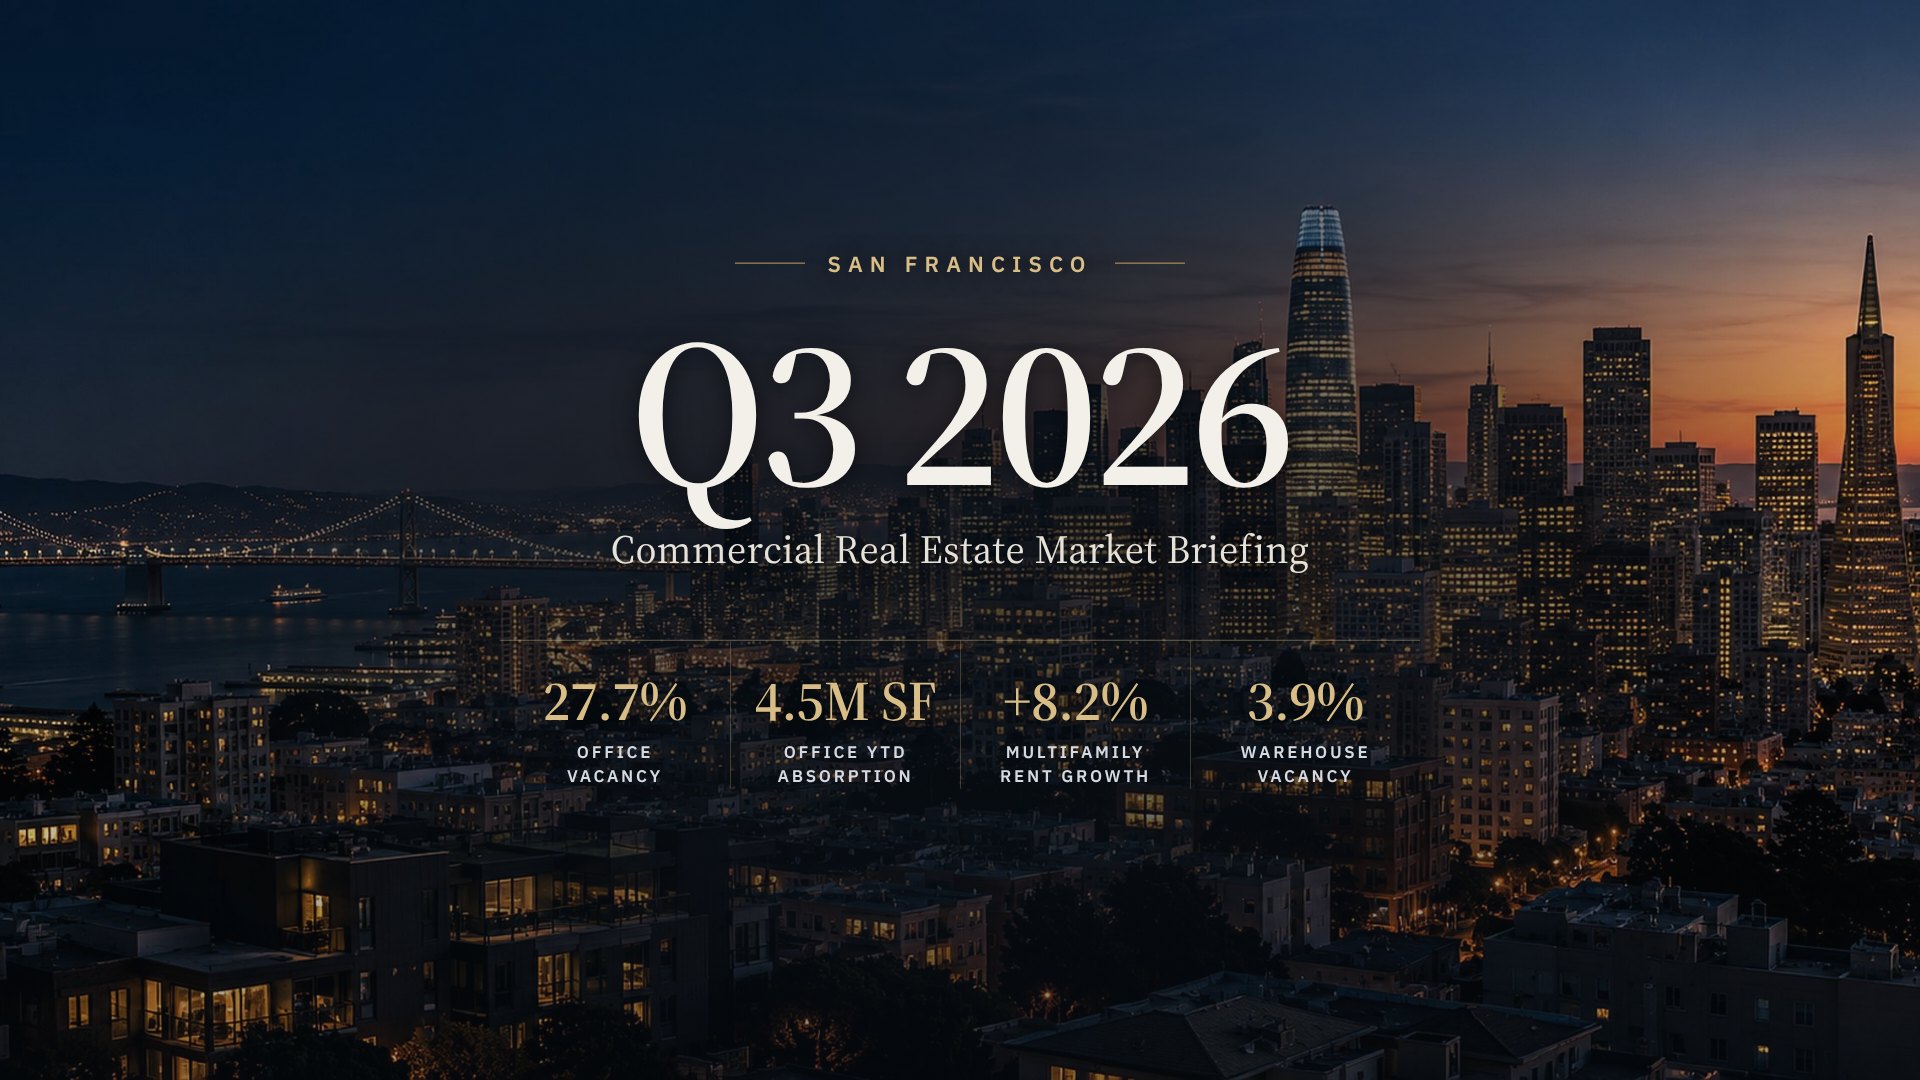
As of Q3 2026, San Francisco has the strongest recovery story of any major gateway office market. AI-driven leasing has pushed year-to-date take-up past the 2014 record of 10.4M SF, and no new office supply is coming.
Multifamily is the tightest sector, with rents up 8.2% YoY. Industrial is bifurcated: traditional warehouse is healthy, while flex/R&D and life science work through excess space. Retail is stabilizing unevenly.
Financing is easing. Crexi new origination rates across all four property types are 6.15–6.23%, roughly 54–61 bps below Q3 2025.
| Sector | Key Fundamental | Momentum Signal | Crexi Cap Rate (Q3) | Crexi Closed $/SF | Read |
|---|---|---|---|---|---|
| Office | 27.7% vacancy (CBRE Q3) | +1.3M SF Q3 absorption (CBRE) | 6.00% (asking) | $442.60 | Genuine AI-led recovery; zero new supply |
| Multifamily | $3,301/mo asking rent, +8.2% YoY (June) | Market cap rate -3.9% QoQ | 5.52% (market) | $431.90 | Tightest sector; cap rates compressing |
| Industrial | 3.9% traditional / 11.0% flex vacancy (IRR mid-year) | Signed rents +4.3% QoQ | 5.54% (asking) | $327.42 | Warehouse healthy; R&D/life science soft |
| Retail | 7.0% community / 7.7% neighborhood vacancy (IRR) | Days on market -8.3% QoQ | 5.92% (market) | $387.91 | Stabilizing unevenly; more listings |
AI-Led Office Recovery Anchors a Supply-Constrained Market
San Francisco enters Q4 2026 with office fundamentals improving on every major broker scorecard. Multifamily is the tightest it has been this cycle, and there is effectively no new supply across sectors. Industrial and retail remain split by product quality and location. Financing costs are down materially from a year ago.
- Office vacancy (CBRE): 27.7%. Down 370–410 bps YoY across brokers.
- Office YTD net absorption (CBRE): 4.5M SF, with 1.3M SF in Q3 alone.
- Multifamily asking rent (June): $3,301/mo. +8.2% YoY, nation-leading.
- Industrial signed lease rate (Crexi): $19.20/SF/yr. +4.3% QoQ.
- Retail closed price/SF (Crexi): $387.91. -6.3% QoQ.
- Office under construction (CBRE): 0 SF. No Q3 deliveries; 90.11M SF inventory.
Office: Broker Scorecard, Q3 2026
All brokers show vacancy falling.
| Broker | Vacancy | Q3 Net Absorption | YTD Net Absorption | Asking Rent | YTD Leasing |
|---|---|---|---|---|---|
| CBRE | 27.7% | 1.3M SF | 4.5M SF | $75.73/SF direct | 10.3M SF |
| JLL | 30.8% | n/a | 2.94M SF | $74.20/SF direct; $79.05 Class A | n/a |
| Colliers | 27.4% | 537K SF | 2.6M SF | $79.30/SF effective (+6.0% YoY) | 12.5M SF |
| Cushman & Wakefield | 29.3% | 405K SF | ~2.9M SF | $72.68/SF (+3.4% QoQ) | 9.0M+ SF |
| Kidder Mathews | 26.0% | 1.07M SF | 2.75M SF | $49.29/SF FSG direct | 10.03M SF |
| Savills | n/a | n/a | n/a | n/a | 12.1M SF |
- CBRE: vacancy of 27.7%, with 4.5M SF of YTD net absorption and $1.11B of Q3 investment volume.
- Colliers: 27.4% vacancy, down 370 bps YoY, with 12.5M SF of YTD leasing.
- Cushman & Wakefield: the $72.68/SF asking rent marks the largest quarterly jump (+3.4%) since Q1 2020.
- Crexi: lease days on market fell 5.5% QoQ to 193.
Demand is concentrated among AI and technology occupiers. Notable deals include Anthropic at 300 Howard (407K SF) and 400 Howard (104K SF), OpenAI at 1800 Owens (282K SF), and Together AI (154K SF). The City and County of San Francisco also committed to 505K SF at 1455 Market. Cushman & Wakefield cites Amazon (525 Market), Sierra AI (185 Berry), Brex (270 Brannan), and Cognition AI (333 Brannan) among Q3 deals.
Capital is following the leasing:
- CBRE logged $1.11B of Q3 office investment and $2.91B YTD.
- JLL reports institutional investors now account for 60–70% of office investment, up from 20% two years ago.
- The Q1 sale of Transamerica Pyramid Center for $691.3M ($908/SF) set a pricing marker for trophy product.
- CBRE also reports that 64% of tech firms plan to expand their office footprint over the next three years.
Office Submarkets (Colliers Q2 2026)
| Submarket | Vacancy | Availability | Q2 Net Absorption | Avg Asking Rent |
|---|---|---|---|---|
| Mission Bay | 10.1% | 7.6% | -15,258 SF | $100.31/SF |
| South Financial | 25.1% | 25.8% | 485,523 SF | $78.61/SF |
| North Financial | 30.9% | 31.7% | 33,395 SF | $74.02/SF |
| Jackson Square | 17.3% | 20.3% | 2,872 SF | $73.71/SF |
| SOMA East | 37.4% | 35.2% | 31,887 SF | $65.45/SF |
| Mid-Market | 29.6% | 27.7% | 6,252 SF | $53.70/SF |
| Union Square | 18.9% | 19.3% | 50,556 SF | $58.70/SF |
| Yerba Buena | 54.1% | 47.3% | 90,464 SF | $70.15/SF |
| Citywide | 28.0% | 28.4% | 704,143 SF | $72.23/SF |
Sublease availability fell to 4.5% in Q2, a post-pandemic low. The South Financial District accounted for most of the quarter’s positive absorption.
Crexi office metrics for the CBSA show the same direction:
- Asking cap rate eased to 6.00% (-1.7% QoQ).
- Closed pricing held at $442.60/SF.
- Lease days on market fell to 193 (-5.5% QoQ).
- Sale days on market rose to 230 (+3.5% QoQ).
Multifamily: Tightest Sector in the Market
| Metric | Value | Change |
|---|---|---|
| Asking rent (June 2026) | $3,301/mo | +8.2% YoY |
| Listings offering concessions | 24.9% | +8.9 ppts YoY (national: 39.7%) |
| Income needed to afford typical rent | $132,059 | n/a |
| Crexi market cap rate | 5.52% | -3.9% QoQ |
| Crexi asking cap rate | 5.40% | -1.6% QoQ |
| Crexi closed price/SF | $431.90 | +1.8% QoQ |
| Crexi closed price/unit | $400,000 | +3.8% QoQ |
| Crexi sales days on market | 152.5 | -2.7% QoQ |
| Crexi signed rent (unit/mo) | $2,295 | +1.3% QoQ |
| Crexi 2BR asking rent | $2,875/mo | +0.9% QoQ |
Asking rents rose 8.2% YoY to $3,301/month in June, leading the nation. Only 24.9% of listings offered concessions, versus 39.7% nationally.
Cap rate compression, rising per-unit pricing, and faster absorption of listings point to growing buyer conviction. Leverage remains conservative at a 75.0% active LTV. Concessions remain in about a quarter of listings, so landlord pricing power is strong but not absolute.
Industrial: Warehouse Healthy, Flex/R&D Working Through Excess
| Segment / Geography | Vacancy | Asking Rent | Net Absorption | Period |
|---|---|---|---|---|
| SF proper (CBRE) | 8.3% | $1.82/SF/mo IG | +155,156 SF | Q1 2026 |
| Peninsula (CBRE) | 5.4% | $1.99/SF/mo NNN | +190,491 SF | Q1 2026 |
| Peninsula (Colliers) | 4.8% | $1.93/SF/mo NNN | -27,233 SF | Q1 2026 |
| Traditional industrial (IRR) | 3.9% | $14.5/SF | n/a | Mid-year 2026 |
| Flex industrial (IRR) | 11.0% | $23.7/SF | n/a | Mid-year 2026 |
San Francisco going-in cap rates are 5.50% for industrial and 5.75% for flex, well below national benchmarks of 6.46% and 6.95%. IRR places the market in Recession Stage 3 but forecasts roughly 10% rent growth over 36 months. CBRE notes SF proper asking rents are still 28.3% below their Q1 2023 peak. Peninsula R&D vacancy topped 25% in early 2026.
Demand is coming from:
- Tech hardware and advanced manufacturing: Zoox, Zipline (110K SF in South San Francisco), and CellLink (87K SF in Redwood City).
- Life science capital: Healthpeak’s acquisition of the 1.6M SF Gateway Boulevard campus signals long-term confidence despite Peninsula R&D vacancy above 25%.
On Crexi, signed lease rates rose 4.3% QoQ to $19.20/SF/yr, the strongest gain of any sector, and sales days on market fell to 205. Closed pricing dropped 6.6% QoQ to $327.42/SF.
Retail: Premium Rents, Uneven Recovery
| Metric | SF Community | SF Neighborhood | National Community | National Neighborhood |
|---|---|---|---|---|
| Vacancy | 7.0% | 7.7% | 8.9% | 10.9% |
| Asking rent | $46.2/SF | $37.0/SF | $27.1/SF | $20.1/SF |
| Going-in cap rate | 6.00% | 6.25% | 6.54% | 7.14% |
IRR expects a -1.0% rent change over the next 12 months but +6.07% over 36 months. The construction pipeline is only 0.17% of inventory.
Neighborhood-serving and F&B/experiential concepts are winning. Downtown legacy centers, including San Francisco Centre and parts of Union Square, remain impaired. CBRE attributes a Financial District retail recovery to rising office attendance. Retail accounted for 9% of the $20.9B in 2025 Bay Area investment volume.
Crexi retail data for Q3 shows:
- Market cap rate compressed to 5.92% (-1.3% QoQ).
- Signed lease rates rose 4.0% QoQ to $31.20/SF/yr.
- Days on market fell 8.3% QoQ to 224.
- Sales listings rose 11.8% to 420, so more supply is reaching the market as closed pricing softens.
Financing: New Origination Rates by Sector (Crexi)
| Sector | Q3 2025 | Q4 2025 | Q1 2026 | Q2 2026 | Q3 2026 |
|---|---|---|---|---|---|
| Office | 6.80% | 6.67% | 6.26% | 6.17% | 6.22% |
| Multifamily | 6.76% | 6.52% | 6.23% | 6.16% | 6.15% |
| Industrial | 6.77% | 6.67% | 6.27% | 6.21% | 6.23% |
| Retail | 6.80% | 6.67% | 6.25% | 6.18% | 6.21% |
| Sector | Active Mortgage Rate | Active LTV |
|---|---|---|
| Office | 6.26% | 82.5% |
| Multifamily | 6.19% | 75.0% |
| Industrial | 6.32% | 85.0% |
| Retail | 6.36% | 77.7% |
New origination rates are 54–61 bps below a year ago. Rates have flattened over the past two quarters, suggesting most of the easing is already priced in. Median new office loan size rose 27.5% QoQ to $2.825M, an early sign that larger office deals are getting financed.
Forward Signals
Office: Office is positioned for continued tightening. With zero construction and 2.6–4.5M SF of YTD absorption, vacancy should keep falling if AI leasing holds, especially in South Financial and Mission Bay Class A. Office-to-housing conversion incentives and zoning changes could also remove obsolete stock from Yerba Buena and SOMA East over time.
Multifamily: Cap rate compression and nation-leading rent growth favor holders. Concession trends are the watch item for whether pricing power broadens.
Industrial: Small-bay and last-mile warehouse should outperform. Flex/R&D recovery is slower and hinges on life science tenant consolidation running its course.
Retail: IRR’s near-term rent dip and rising Crexi listing counts suggest selective buying opportunities in neighborhood-serving and Financial District locations.
A Few Cautions on Reading These Numbers
- Office vacancy ranges from 26.0% to 30.8% depending on the broker’s methodology and geography. All sources agree the direction is down.
- Current-quarter premium statistics were not available for multifamily, industrial, or retail. Those sectors rely on Q1–Q2 2026 and mid-year reports.
- Crexi metrics cover the full San Francisco-Oakland-Fremont CBSA.
- Crexi Q3 closed-sale counts (25–26 for office, industrial, and retail; 220 for multifamily) appear to reflect partial-quarter reporting, so treat closed volume, NOI, and closed-price swings with care.
Thinking about buying, selling, or refinancing in San Francisco?
Every submarket and asset type is moving differently. Understand where your property stands today before you make your next move.
Request a confidential property valuation from One West Group.
One West Group | eXp Commercial
Investment Advisory | Capital | Brokerage
Sources: CBRE, JLL, Colliers, Cushman & Wakefield, Kidder Mathews, Savills, IRR, and Crexi market data, as cited. Market commentary dated October 18, 2026. This briefing is provided for general information and does not constitute investment, lending, legal, or tax advice.